Achieving Page Speed with a Data-heavy Visualisation
(or, Why I hate Tableau)
SingaporeJS (2020), BrisJS (2023)
Murray Bourne
(formerly) intmath.com
Background (a)
- Wife: "This site is sucky!"
- Holy grail:
- < 1 second load time on phone
- Minimal blocking by JS and CSS
- Low bandwidth
- No layout shift
Background (b)
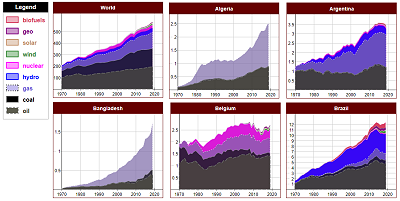
- Tableau Public example: Energy Consumption
- Slow
- Bloated
- Clunky
- Uses iframe (why??)
- Uses one huge background image
- 1500 px wide - not mobile friendly.
Tableau
- Is popular for data visualization
- Is versatile - has many different chart types:
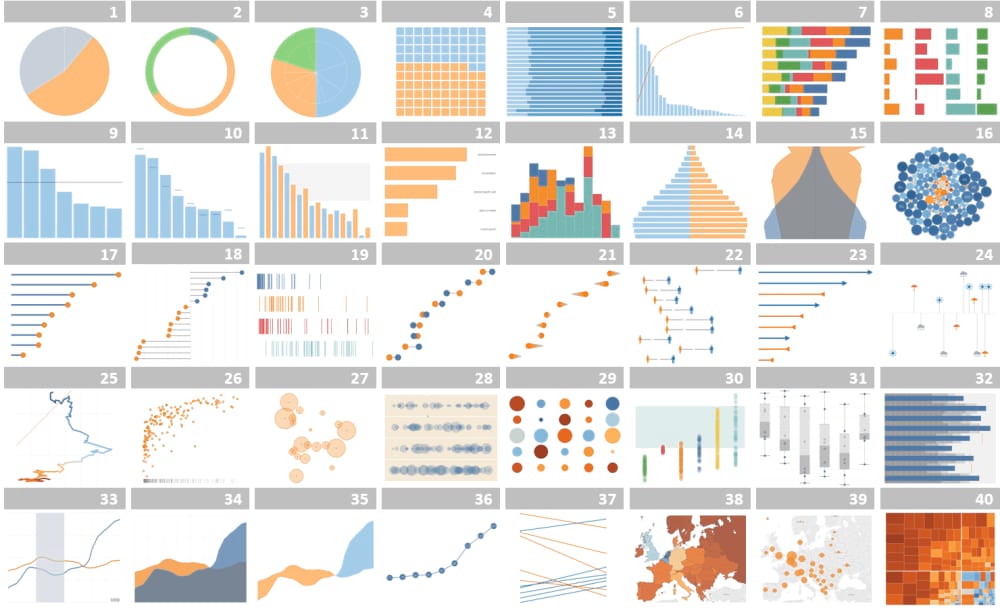
- Allows filtering and sliders
- Handles huge data sets
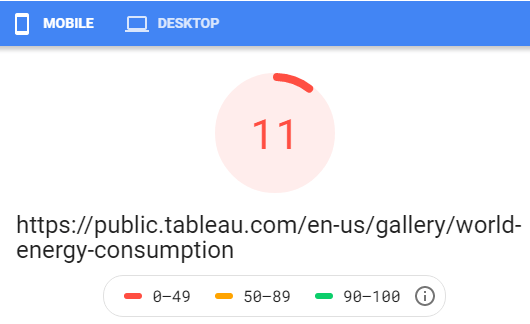
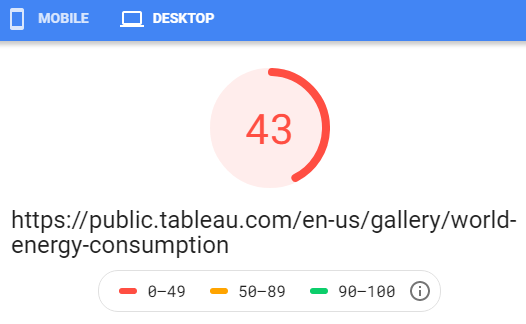
Tableau example's speed (Lighthouse)
- Pagespeed: Mobile
- Pagespeed: Desktop
Bloated
- Bandwidth: 8.95 mB
- 1 mB unused JS
- Clunky
- Has "whiteouts"
- Ignores/delays user interactions
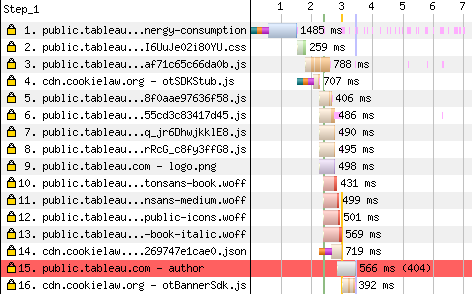
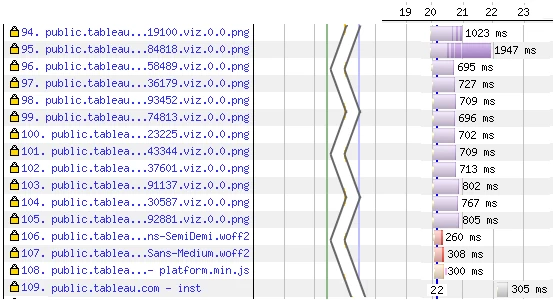
Tableau example's analysis (a)
- Webpagetest.org result:
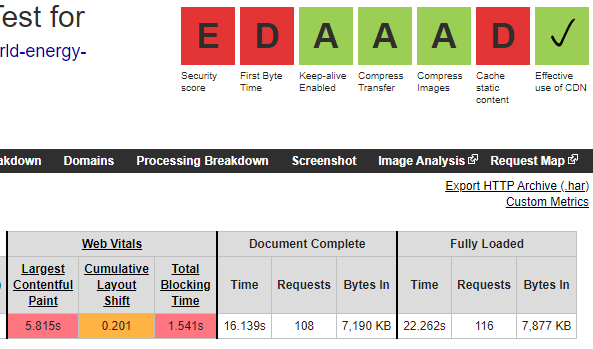
- 23.6 s to load
- 116 requests
- 20 different domains
- Blocking time: 5.5 s
Tableau example's analysis (b)
Alternative version: fast and mobile friendly
- Same data;
- Similar outputs:
- World Energy Consumption - Yearly totals
- Total Energy Consumption By Country
How? (a)
- Uses SVG for charts
- Created on the server using PHP; cached
- 3 charts appear on page load;
- Rest are retrieved via AJAX on scroll
- Inline everything:
- CSS
- JS
- SVG
How? (b)
- JS data blobs
- Needed for graph interactions;
- Created on the server using PHP;
- 3 blobs appear on page load;
- Rest are retrieved via AJAX as needed
cunArrays['AUS'] = [];
cunArrays['AUS']['oil'] = [1.0447,1.0737,...]
cunArrays['AUS']['coal'] = [0.8341,...]
cunArrays['AUS']['gas'] = ...
...
brdPropsArr['asvg3SVG']['actualYmin'] = -0.30475;
brdPropsArr['asvg3SVG']['actualYmax'] = 2.74274;
brdPropsArr['asvg3SVG']['yMax'] = 2.43799;
How? (c)
- Uses Cloudflare CDN (free)
- "Cache everything"
- Uses one domain only, yet has:
- Google analytics
Speed of improved version
- Pagespeed: Mobile

- Pagespeed: Desktop

Analysis of improved version (a)
- GTMetrix: Desktop
- Blocking time: 0 ms
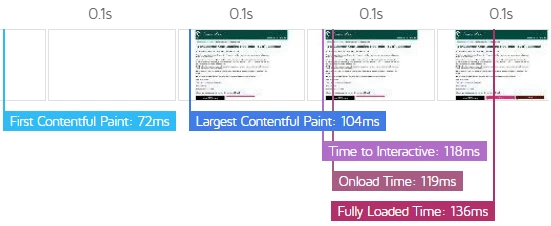
Analysis of improved version (b)
- WebPageTest: Mobile result


- [WebPageTest data]
Bandwidth of improved version
- Initial page load: ~ 110 kB (cf 8.95 MB: 98.8% better)
- 273 kB in total (fully scrolled): 96.9% better
- JS library bandwidth: 0 kB (cf 461 kB: ∞ better)
- Image bandwidth: 0 kB (cf 4.72 MB: ∞ better)
- 0 CLS (cf 0.507: ∞ better)
Summary

For fast pages:
- Keep it lean - optimise everything
- Avoid unneccesary javascript bloat
- Reduce domain calls
- Inline everything
- Avoid multiple Webfonts
- JIT (just in time) - images, ads
- Cache everything!
Conclusions
- Achieving speed with a data-heavy page is possible
- No site should be sucky!
Thank you!
Questions? Comments?
 @bourne_2_learn